../pvss.htm menu.gif basics.gif

Selecting a manager

Control scripts are programs that let you perform a huge range of tasks in WinCC OA. They are used in a variety of situations for different tasks:

  • Animation of graphics, for data point manipulation and much more in the event scripts of the graphics objects (in a runtime User Interface manager: UI)

  • For runtime and initialization scripts in a dedicated Control manager (CTRL)

In these cases several of such managers can exist simultaneously in one WinCC OA system, so it is important to select the manager in which the script to be debugged is running. Since several scripts can also run in each manager, the relevant script needs to be selected as well (see Selecting a script).

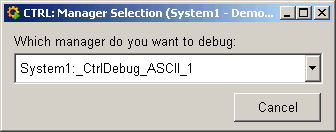
Open the panel CTRLdbg-sel.pnl (<wincc_oa_path>/panels/vision) which you can use to select the manager to be debugged.


Figure: Panel for selecting the manager
CTRL_Debuggerneu-2.gif


  • Which manager do you want to debug: the combo box contains the list of possible managers from which you can make your selection.

  • Cancel closes the Panel.


IconNote

What you are actually doing here is selecting the "communications data point" (see Detailed information on the CTRL Debugger). The Debugger controls program execution in the selected manager via the communications data point. Therefore the required manager can only be studied if the communications data point for this manager has been created. Once this data point has been set up, the associated manager is included in the selection list.

After selecting the required manager (or rather the data point), the actual Debugger panel opens immediately.

Top Of Page


V 3.11 SP1

Copyright ETM professional control GmbH 2013 All Rights Reserved